
Building a Revenue Engine Analytics System
Revenue Operations Expert Series

An effective analytics framework in Revenue Operations needs a combination of the right tools and the right methods to use those tools.
Your data model is your destiny.
The geography of your business systems and processes will drive what data you capture, and what condition that data is in.
Let’s talk about how to set-up your own revenue engine analytics system.
Setting Up The Data Warehouse
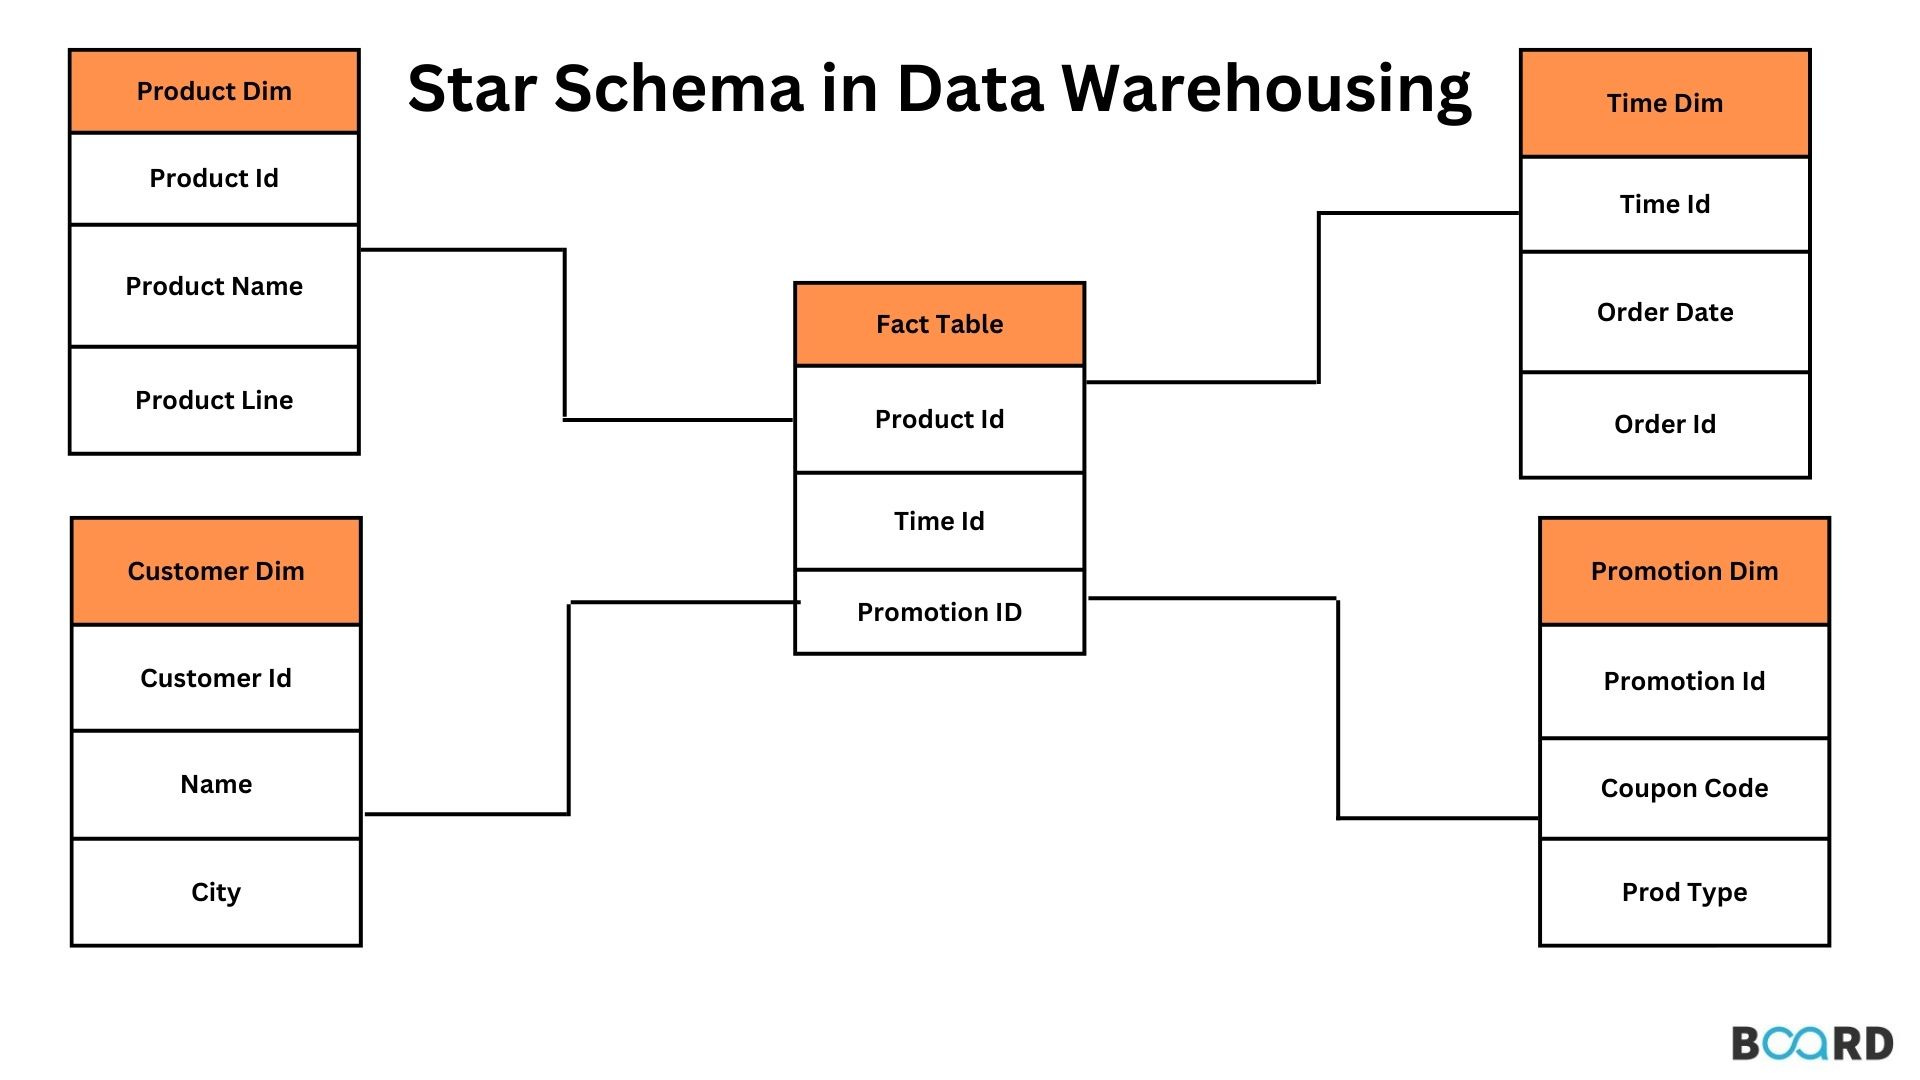
You can’t just upload all your data from Salesforce to BigQuery and call it a day. You need a schema. I suggest the star schema.
A star schema is a database design approach optimized for data warehousing and business intelligence, making it ideal for RevOps' need to analyze data from disparate systems like Salesforce, HubSpot, and QuickBooks. At its heart is the fact table, containing quantitative data or "facts" like revenue, deal size, or costs. This fact table is surrounded by dimension tables, which provide descriptive context – the "who, what, where, when" of the data. These tables are linked through foreign keys in the fact table that correspond to primary keys in the dimension tables.
In a RevOps scenario, integrating Salesforce, HubSpot, and QuickBooks, we might create a central FactRevenue table. This table would store core revenue-related transactions, including columns for RevenueAmount, CostAmount, Quantity, and DiscountAmount, sourced from QuickBooks and Salesforce. Crucially, it would also include foreign keys like DateKey, CustomerKey, ProductKey,DealKey, MarketingKey, and LeadSourceKey, linking to respective dimension tables.
The dimension tables provide the context. DimDate is a standard dimension offering date attributes like year, quarter, and month. DimCustomer combines customer information from Salesforce and HubSpot, holding details such as CompanyName, Industry, and Segment. DimProduct primarily uses QuickBooks data, potentially enriched with Salesforce, to store product information like ProductName and ProductCategory. DimOpportunity houses information on opportunities from Salesforce, such as StageName and Probability. DimMarketingCampaign, sourced from HubSpot, details marketing campaigns with fields like CampaignName and CampaignType. Finally DimLeadSource shows the origin of leads.
This star schema design enables straightforward and efficient querying. For instance, analyzing total revenue by industry for a specific quarter and product category, attributed to a particular campaign type, becomes a relatively simple SQL query joining the FactRevenue table with the relevant dimension tables. The benefits are clear: simplified queries, improved performance due to optimized structure, enhanced understandability for users, and the flexibility to adapt to evolving needs. Importantly, it provides a unified view of revenue performance across sales, marketing, and finance.
However, implementing a star schema requires careful consideration. A robust ETL (Extract, Transform, Load) process is essential to pull data from the source systems, transform it to fit the schema, and ensure data quality. Data governance is crucial, with clear definitions for dimensions and facts. Handling changes in dimension attributes over time (Slowly Changing Dimensions) needs a strategy. Finally choosing the correct level of data granularity in the fact table is critical. Despite these considerations, a well-designed star schema provides a powerful foundation for a RevOps analytics framework.
What is a Star Schema?
At its simplest, a star schema is a way of organizing data in a database, specifically designed for data warehousing and business intelligence applications. Think of it as a blueprint for how data is structured and related, optimized for answering business questions quickly and efficiently. Unlike transactional databases (like the ones that power your CRM or ERP system in their raw form), which are designed for fast data entry and updates, a star schema is designed for fast data retrieval and aggregation. This is achieved through a specific structure that resembles, well, a star.
As we teased in the intro, the central component of the star is the fact table. This table contains the core measurements or metrics that you want to analyze. These are typically numerical values representing business events or transactions. Examples in a RevOps context include revenue, cost of goods sold, number of deals closed, marketing qualified leads (MQLs) generated, or customer churn rate. The fact table is usually very "tall" (containing many rows, each representing a transaction or event) but relatively "narrow" (containing a limited number of columns, primarily the metrics and foreign keys).
Surrounding the fact table are the dimension tables. These tables hold the descriptive attributes that provide context to the facts. They answer the "who, what, where, when, why, and how" questions related to the data in the fact table. Dimensions are typically things like customer details (name, industry, location), product information (name, category, price), time periods (date, month, year), sales representative details, marketing campaign information, or geographic locations. Dimension tables are generally "short" (fewer rows than the fact table) but "wide" (containing many columns, each representing a different attribute).
The connection between the fact table and the dimension tables is established through foreign keys. A foreign key in the fact table is a column that references the primary key (a unique identifier) of a dimension table. This relationship is what allows you to "slice and dice" the data – to analyze your metrics across different dimensions. For example, you might want to see revenue (a fact) by industry (a dimension), by product category (another dimension), and by quarter (yet another dimension). The star schema's structure makes these kinds of queries extremely efficient.
When you design these systems well they can be a truth engine for revenue leaders, managers and individual contributors.
Why are Star Schemas So Important for RevOps?
