Revenue Engine Analytics - Part III
Update: Thank you so much for spreading the word on Linkedin, across RevOps communities and in Discord/Slack and wherever else nerds like us gather. Thanks to you, we are getting lots of inquiries about sponsored posts, product reviews, speaking engagement opportunities and more. Please fill out this form if you have any inquiries or ideas for ways to collaborate.
Revenue Engine Analytics has been our best performing series of 2024.
Here in Part III we are using Python to connect to our CRM (Salesforce in this example) and perform analysis on opportunity data.
We’re going to start with basic visualizations of our revenue engine.
Then we’ll explore the engine performance and health analytics.
If you haven’t read Part I and II of the series, find links below:
Visualizing The Revenue Engine
Analyzing Opportunity Generation
One of the most important heartbeats of the revenue engine is opportunity generation.
Think of the offense and defense you get from kicking-off new deals. By having a continuous cadence of new deals starting up your pipeline is recharging.
The chances of hitting an “air pocket” of new ARR goes down when you have strong lead generation, lead conversion and opportunity generation systems in place.
By constantly creating new opportunities you give yourself the ability to focus on pipeline development acceleration + deal upsizing to reach your goals.
If you don’t have enough opps at the very top of the funnel it doesn’t matter how efficiently you close deals. You give yourself a chance to win by nailing opportunity generation.
Let’s look at a Python script that will report on this.
# Install the simple_salesforce library
import subprocess
import sys

try:
    import simple_salesforce
except ImportError:
    subprocess.check_call([sys.executable, "-m", "pip", "install", "simple_salesforce"])
finally:
    from simple_salesforce import Salesforce

import pandas as pd
import matplotlib.pyplot as plt
import datetime

# Salesforce credentials
sf_username = 'your_salesforce_username'
sf_password = 'your_salesforce_password'
sf_security_token = 'your_salesforce_security_token'

# Connect to Salesforce
sf = Salesforce(username=sf_username, password=sf_password, security_token=sf_security_token)

# Calculate date range for the last 12 months
today = datetime.date.today()
one_year_ago = today - datetime.timedelta(days=365)

# SOQL query to retrieve opportunities created in the last 12 months
query = f"""
    SELECT CreatedDate
    FROM Opportunity
    WHERE CreatedDate >= {one_year_ago.strftime('%Y-%m-%d')}T00:00:00Z
"""

# Execute the query
results = sf.query_all(query)

# Extract created dates and convert to datetime objects
created_dates = [pd.to_datetime(record['CreatedDate']).date() for record in results['records']]

# Create a pandas Series for the dates
date_series = pd.Series(created_dates)

# Set the index of date_series to a DatetimeIndex
date_series.index = pd.to_datetime(date_series)

# Resample the data by month and count the number of opportunities
# Use 'ME' instead of 'M'
monthly_counts = date_series.groupby(pd.Grouper(freq='ME')).count()

# Plotting the results
plt.figure(figsize=(12, 6))
monthly_counts.plot(kind='bar')
plt.title('Number of Opportunities Created Over the Last 12 Months')
plt.xlabel('Month')
plt.ylabel('Number of Opportunities')
plt.xticks(rotation=45)
plt.tight_layout()
plt.show()
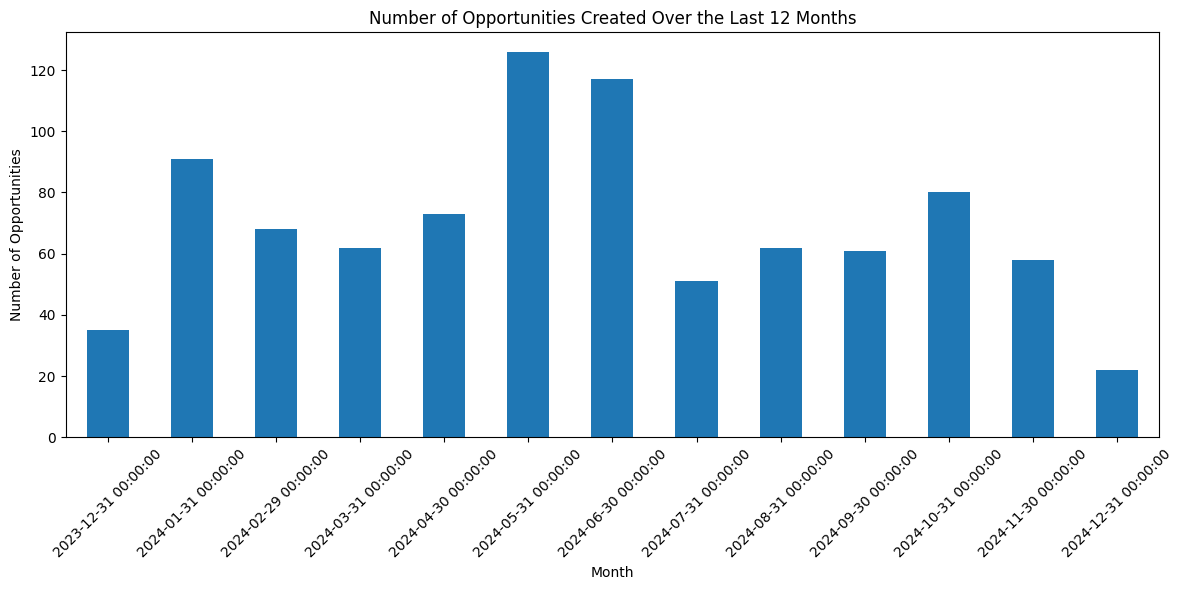
Here’s the output of that code running then we’ll discuss how you can reproduce this in greater detail.
This analysis was run in the first week of December, so we can assume that month will end up closer to the 40 to 60 opps created range.
We can see a very large variance in deal creation rates — in May 2024 this organization created more than 3x their December 2023 amount.. only to see that number cut by a little over 55% 2-months later in July.
There appears to be seasonality but at least we aren’t observing near-zero months.
Explanation of the Script
Import necessary libraries:
simple_salesforce: To connect and interact with Salesforce.pandas: For data manipulation and analysis.matplotlib.pyplot: For data visualization.datetime: For date calculations.
Provide Salesforce credentials:
Replace
your_salesforce_username,your_salesforce_password, andyour_salesforce_security_tokenwith your actual Salesforce credentials.
Connect to Salesforce:
Create a
Salesforceobject using your credentials.
Calculate date range:
Determine the date 12 months ago from the current date.
Construct SOQL query:
Build a query to retrieve the
CreatedDateof all opportunities created within the last 12 months.
Execute query and extract data:
Use
sf.query_all()to execute the SOQL query.Extract the
CreatedDatefrom the query results and convert them to datetime objects.
Create pandas Series and resample:
Create a pandas
Seriesfrom the extracted dates.Resample the series by month (
pd.Grouper(freq='M')) and count the number of opportunities in each month.
Visualize the data:
Create a bar plot using
matplotlib.pyplotto display the number of opportunities created each month.
Security tokens are generated under your personal settings in Salesforce — click “Reset My Security Token” to generate a fresh one to authenticate for these exercises and future tools you build.
We can segment these bars in the chart based on account type, deal size, product(s) included in the opportunity, participation in a target campaign or any other number of segmentations.


